
cellZscope Software version 4.4.0
"If the statistics are boring, then you've got the wrong numbers."
-Edward Tufte
We can't help you with the numbers but in version 4.4.x of the cellZscope software we've built in some great methods to help you with the statistics.
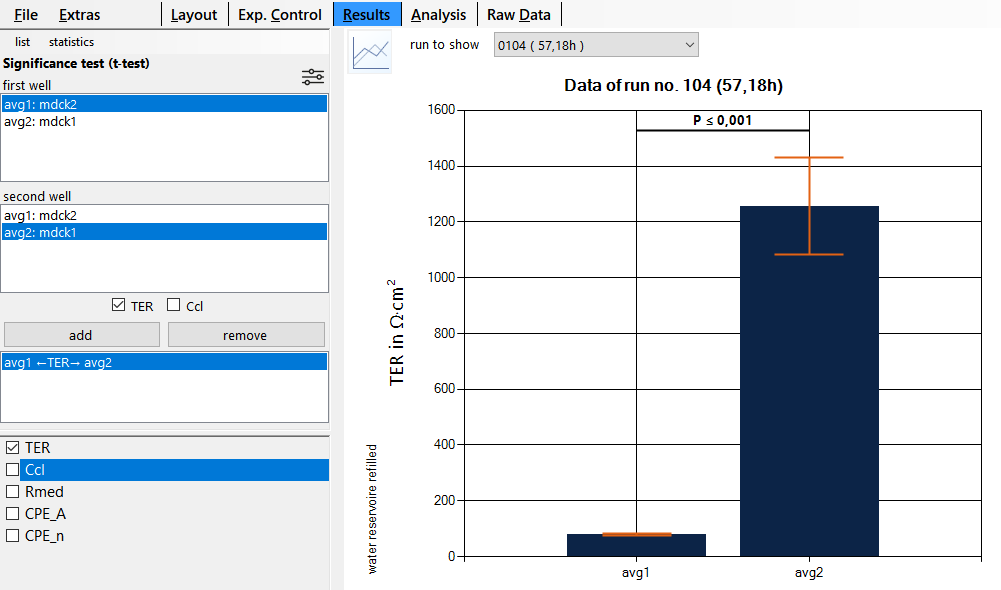
In the bar charts the software can calculate the statistical significance of different averaged wells using the heteroscedastic t-test. Different visualizations of the significance level (including the well-known star labeling) can be selected.
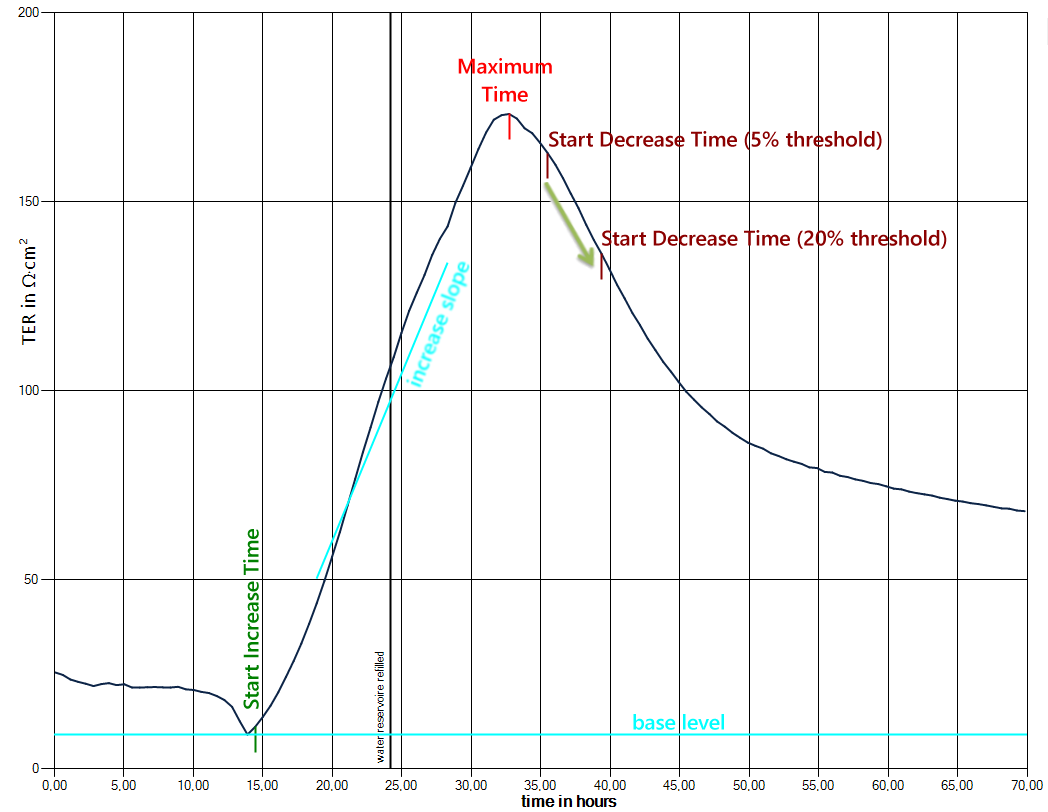
Furthermore we've built in area under curve (AUC) analysis of the TER curves including parameters like:
- the time when the TER starts to increase,
- the maximum value of TER,
- the time when the TER reaches its maximum, and
- the average slope of increase
as an attempt to statistically describe the shape of the TER curves.
As always the software update is for free and the setup files* can be downloaded from our server. Please contact your local distributor or nanoAnalytics if you have any questions.
Kind regards,
Marcus Schäfer
*Minimum requirements for the control computer: 1.0GHz processor speed, 2GB RAM, USB 2.0 port, 1024x768 display, Microsoft Windows® 7 operating system, Microsoft .Net Framework 4.0